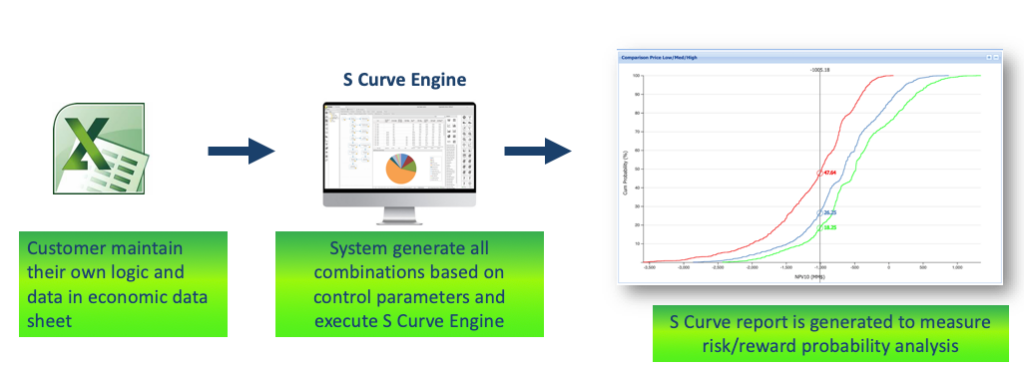
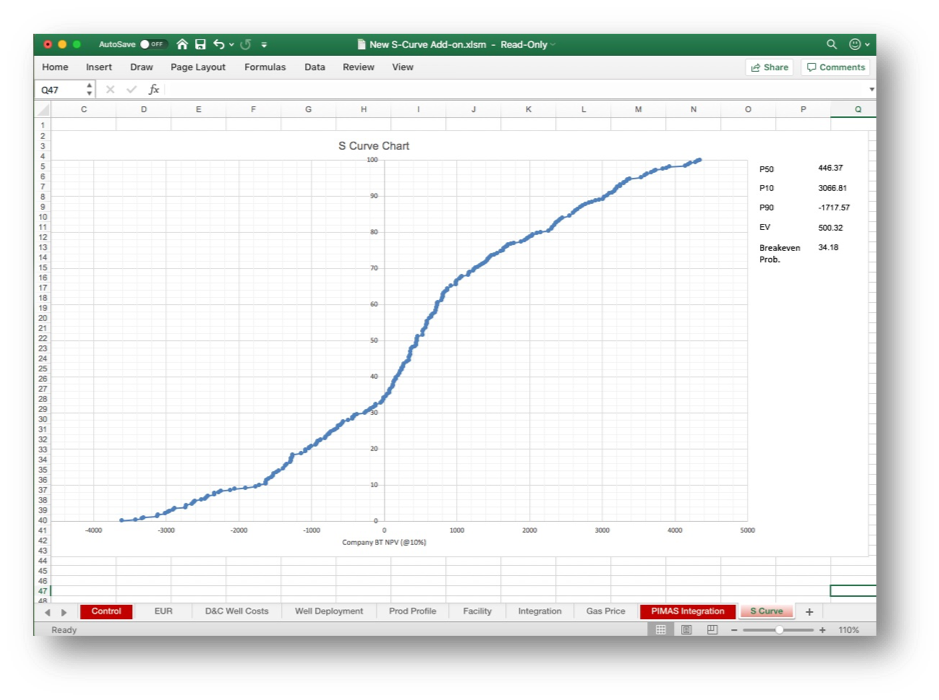
S Curve Analysis (SCA)

S Curve Analysis (SCA) provides project risk measures (e.g. Breakeven Probability) and economic metrics based on total project probability:
* S Curve Analysis uses the theory of Swanson’s Rule and Probability Density Function Discretization.
* SCA has become the foundation of risk analysis and modern Petro-economics decision analysis and has been accepted by the international energy companies as a standard in project evaluation.
* It combines economic indicators (NPV, EV, Cash Flow, Reserves) and calculates probabilities based on a large number of scenarios and data.
* The Breakeven Probability (Failure Rate or Chance of Loss) can be calculated and illustrated using an S Curve.
* SCA can reasonably derive P10/P50/P90 scenarios, and provide guidance in order to avoid unrealistic high and low development scenarios outcomes.
* Decision analysis can be achieved by analyzing and comparing those factors that influence S Curve shape.


Next Steps...
Feel free to contact us for a demo